
Patterns found on closed candles
Channels, triangles, wedges, double tops and bottoms, harmonic ABCDs and more, detected on completed 15M, 1H and 4H candles. A pattern is never drawn from a candle that has not closed.

Chart pattern research for FX
FXPatternLab finds chart patterns, levels and trendlines on closed candles across ten FX pairs, follows recorded cases through to their result, including unsuccessful, invalidated and expired examples, and teaches you to read the shapes yourself.
Available now on Google Play. iOS coming soon to the App Store. Free to start, with Member as an optional subscription and no free trial.
For educational purposes only. Not financial advice. No trade execution.
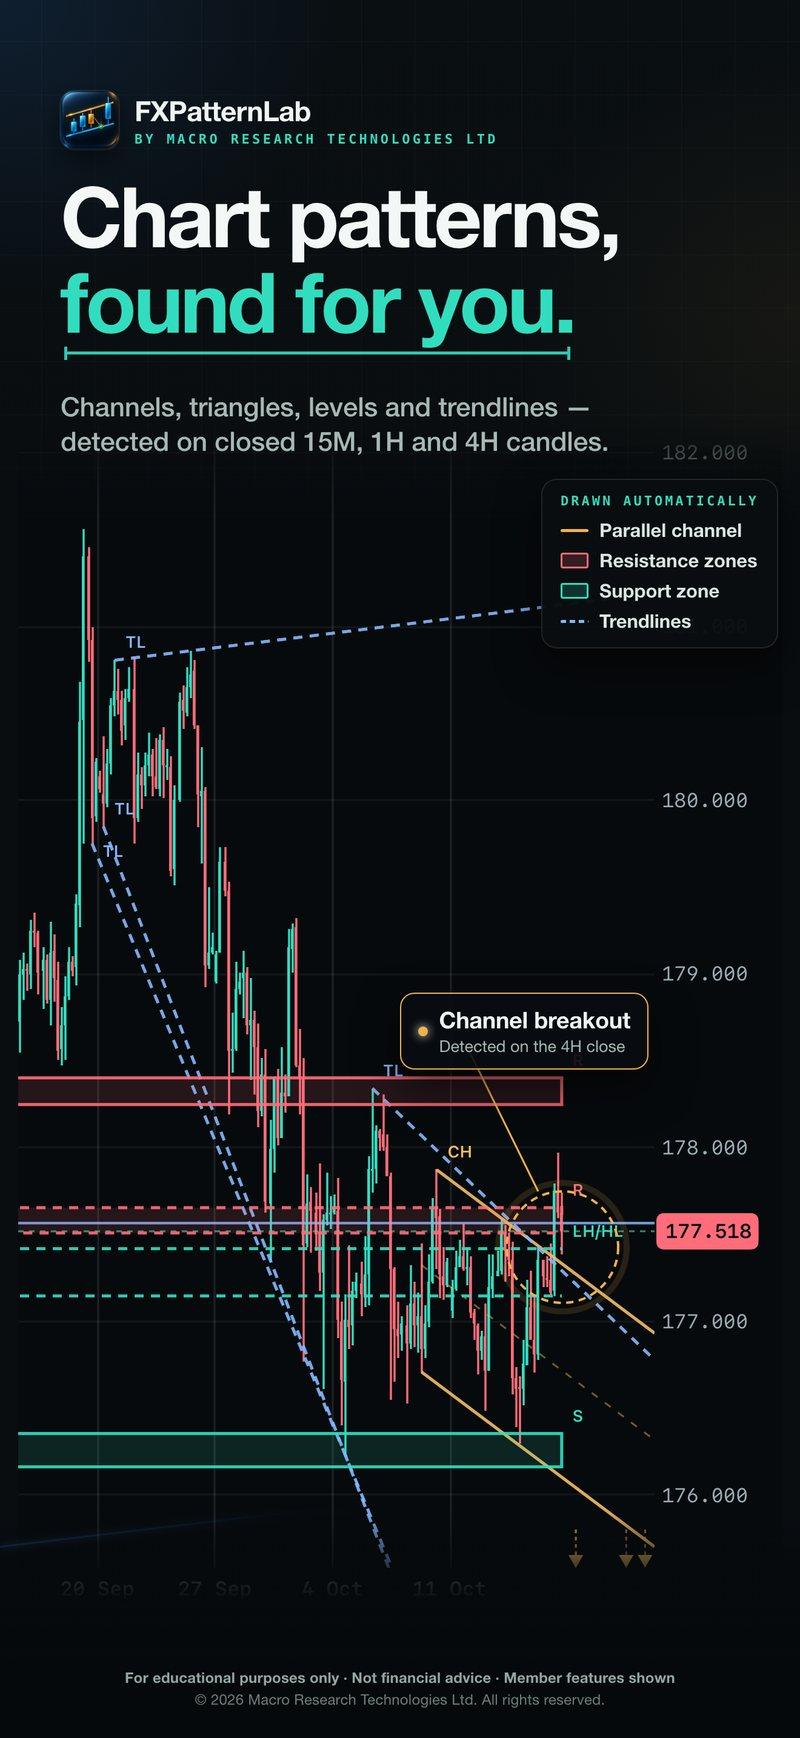
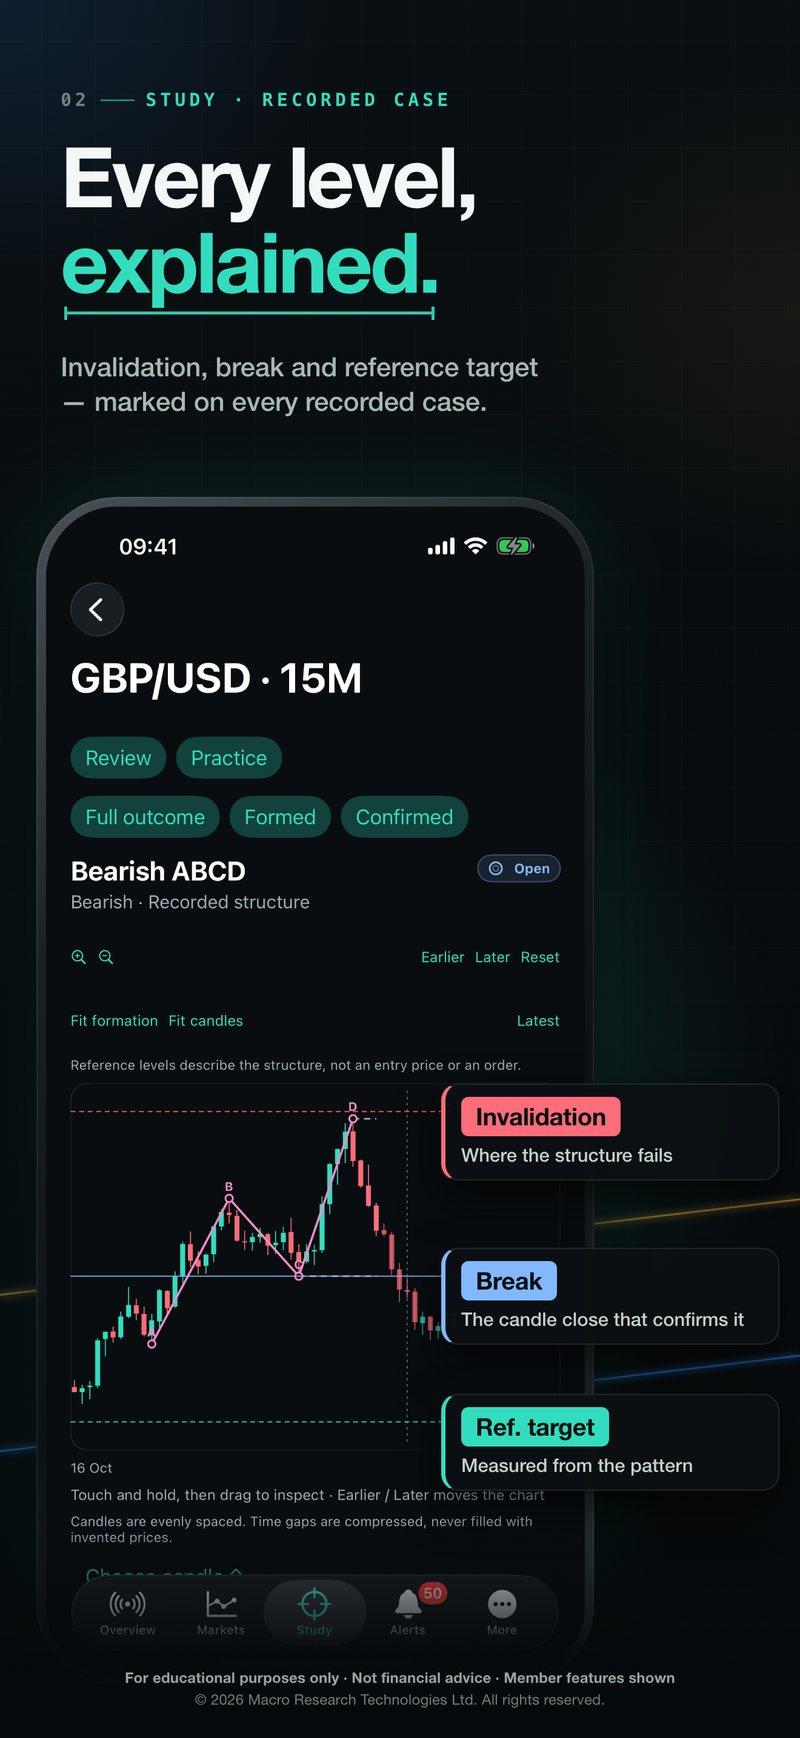
Promotional compositions from the store listing, built from unedited app screens.
Inside FXPatternLab
Patterns, levels, recorded cases, lessons, drawing tools and close-based alerts: what each part of the app shows.
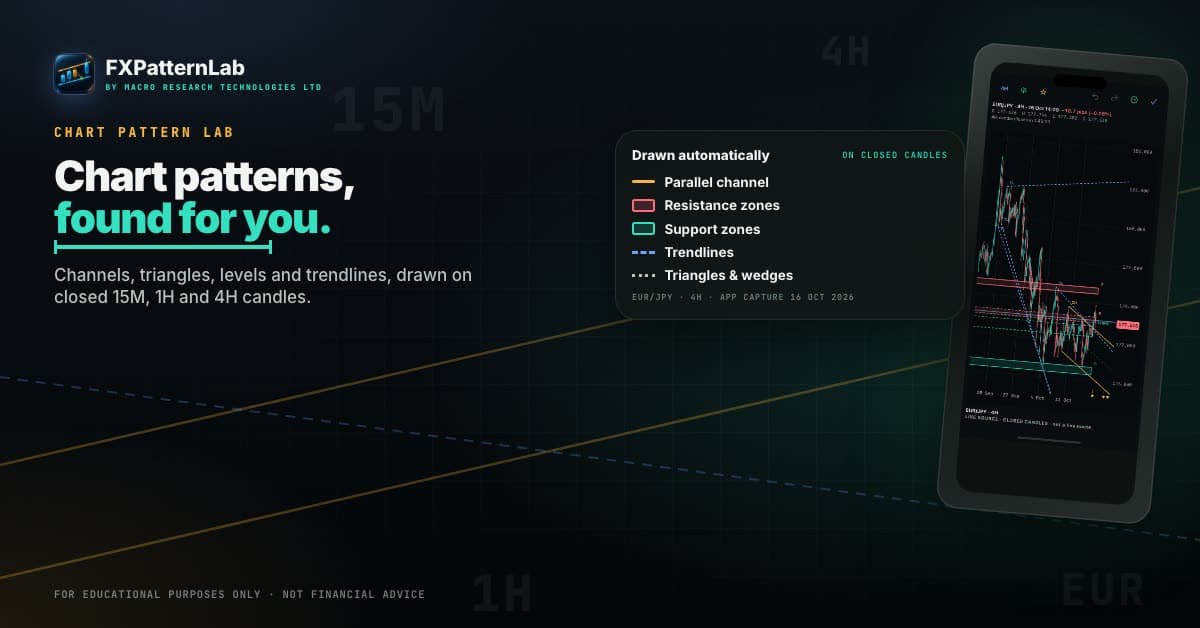
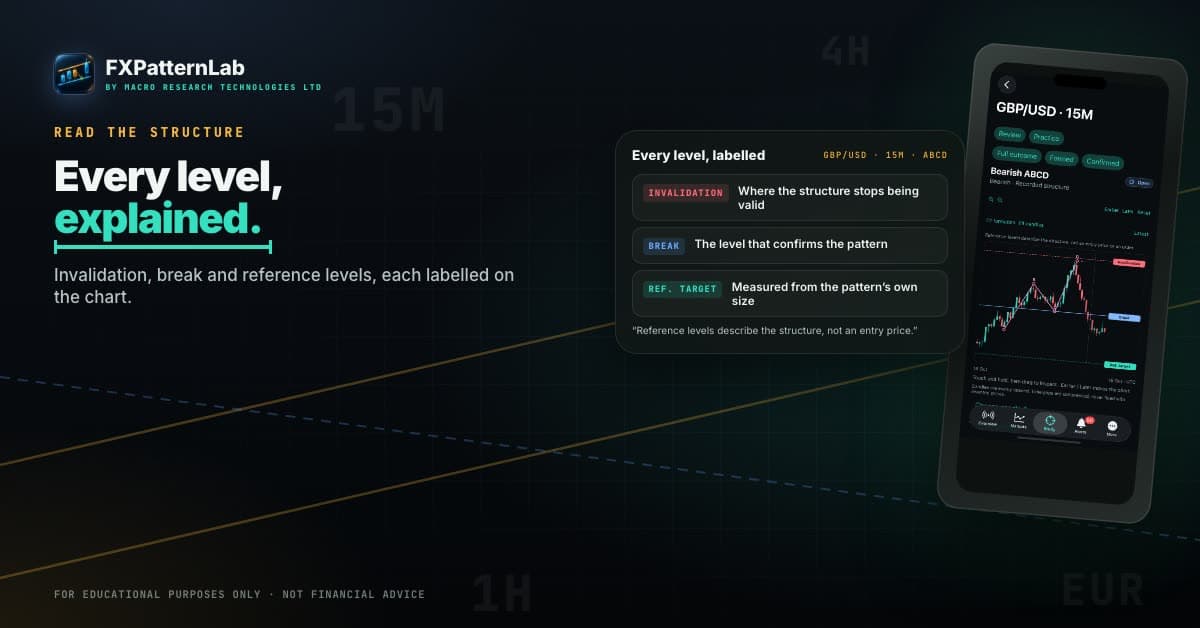
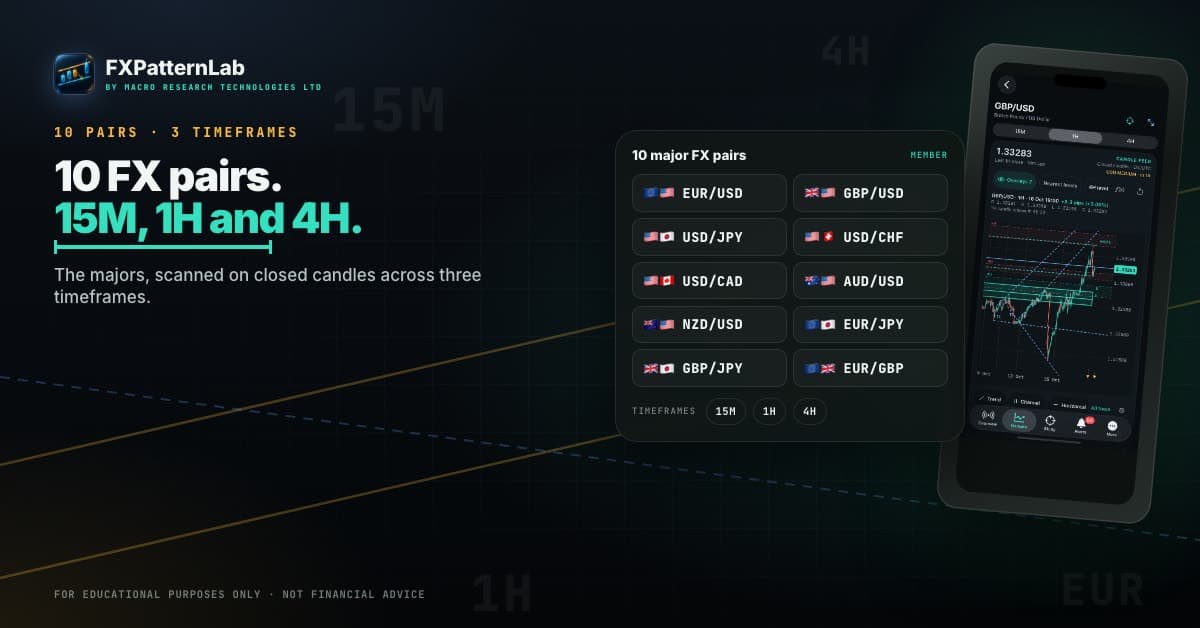
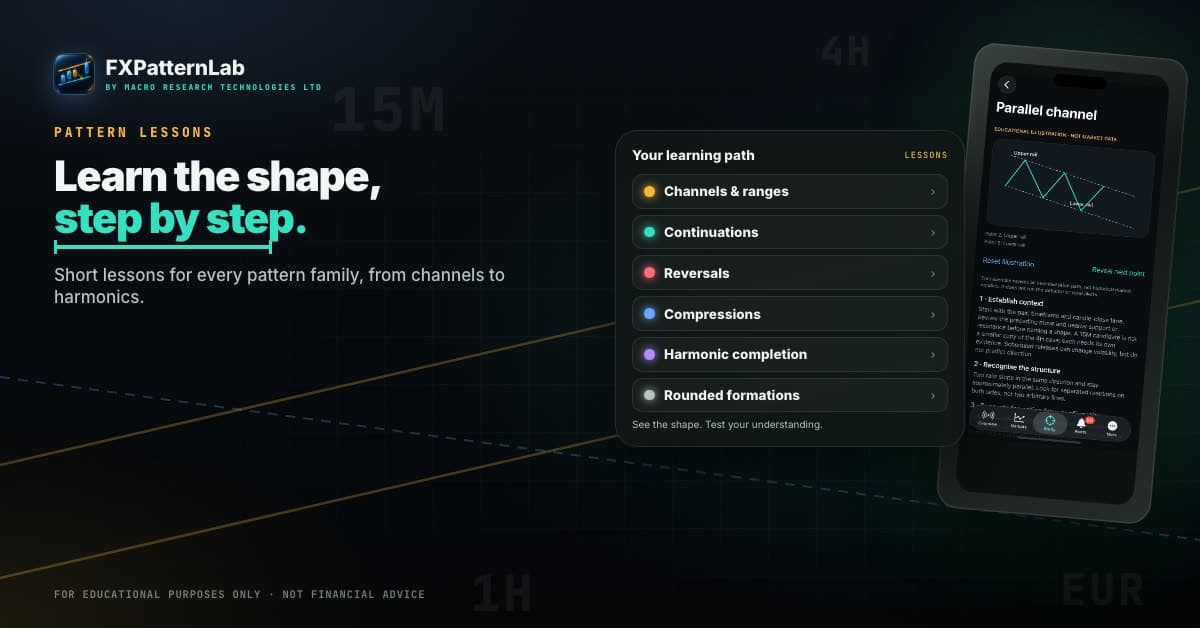
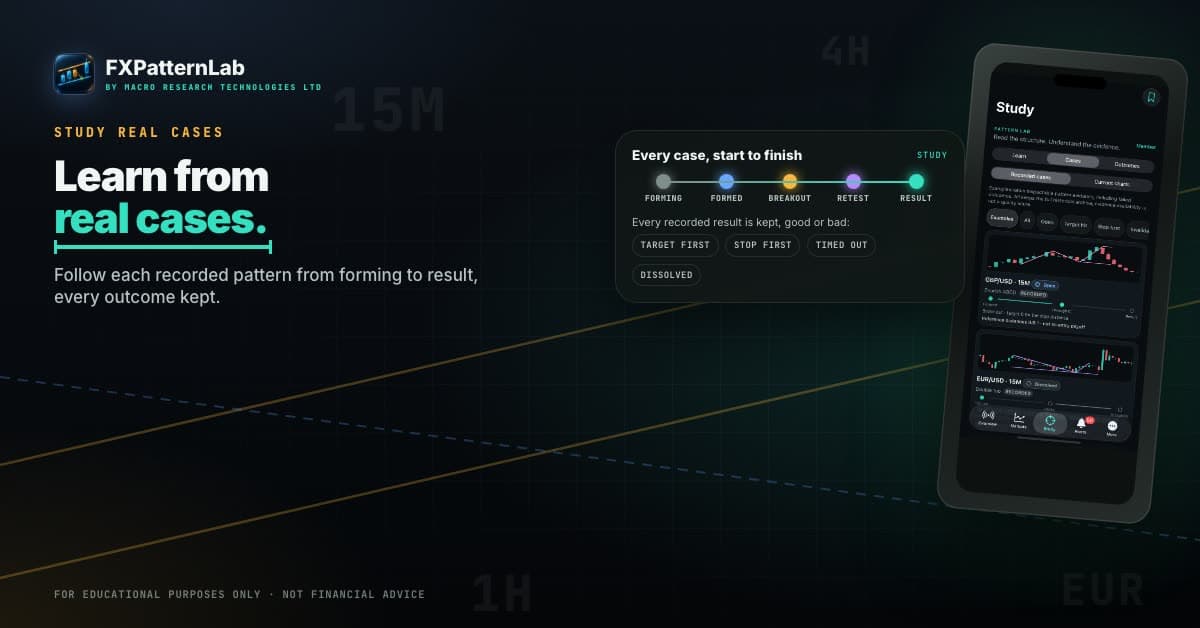
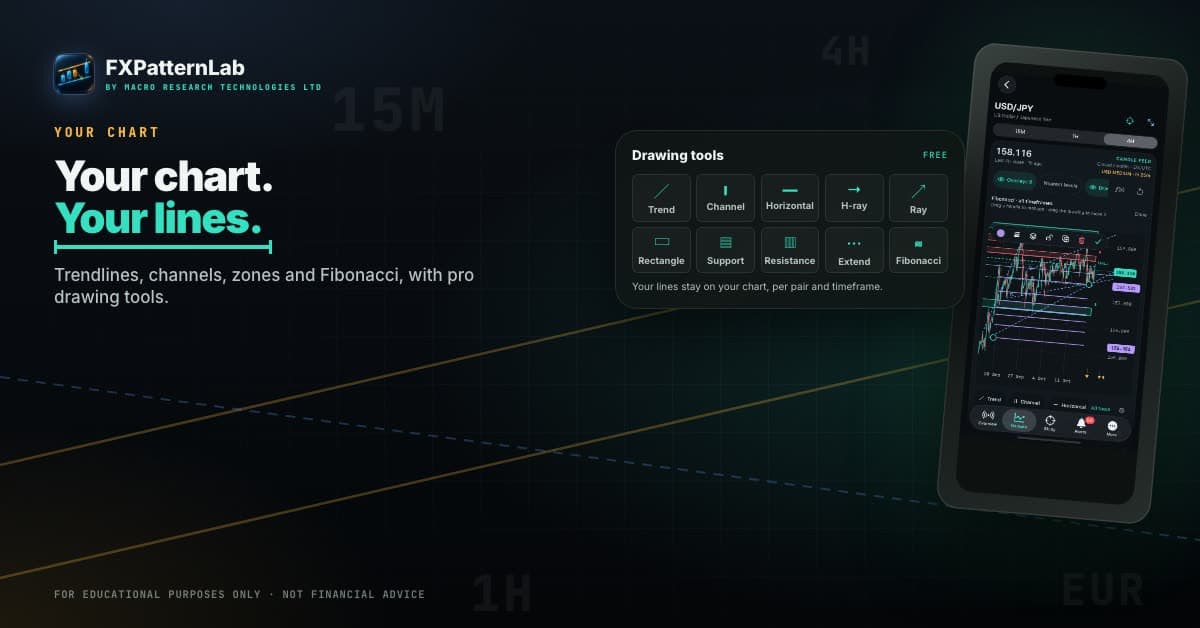
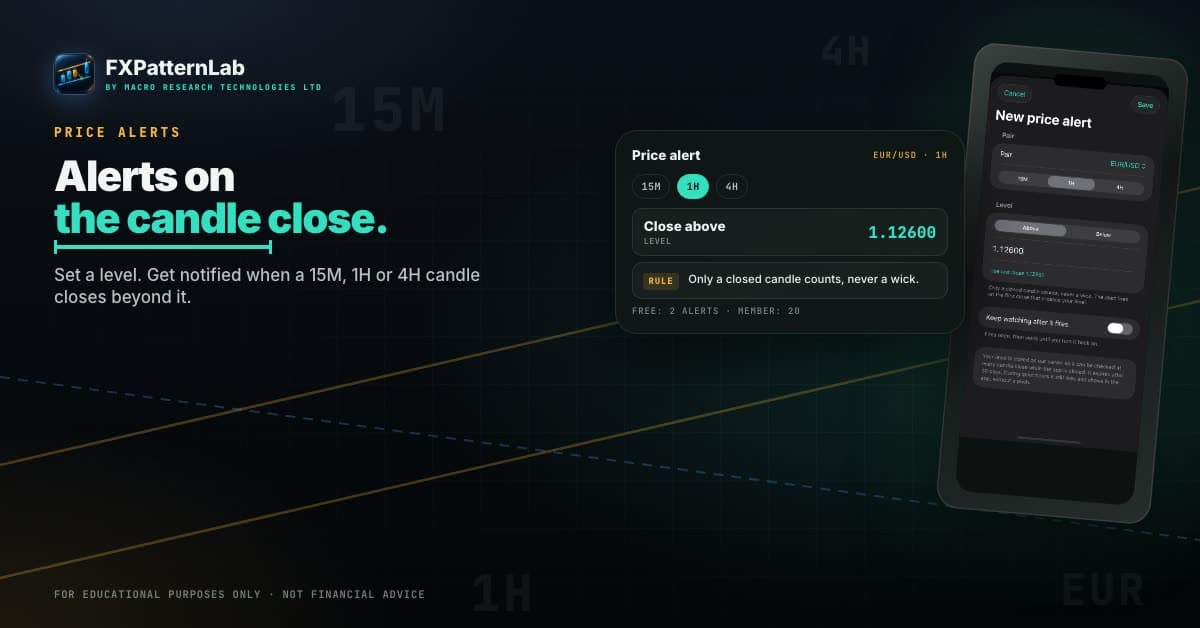
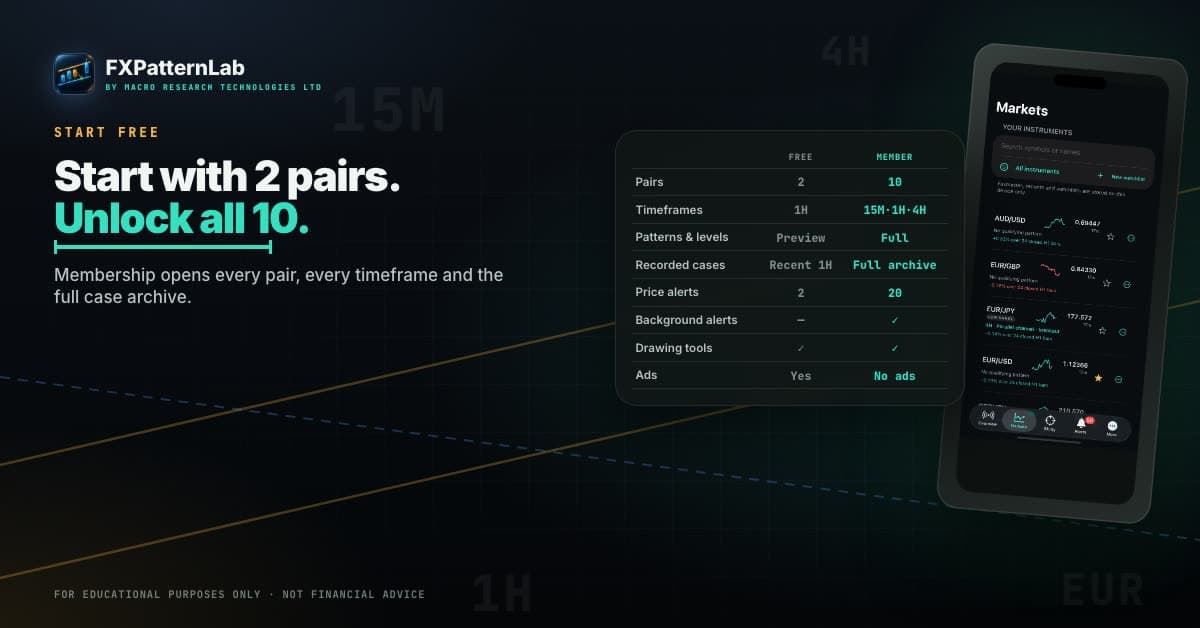
FXPatternLab promotional compositions built around unedited app screens. Panels marked as examples are illustrative. Swipe or scroll for more.
Coverage
Every pair is read on 15-minute, 1-hour and 4-hour candles. Patterns, levels and alerts are only ever drawn from candles that have closed, never from a price that is still moving. The free level includes EUR/USD and USD/JPY on 1H.
On the chart
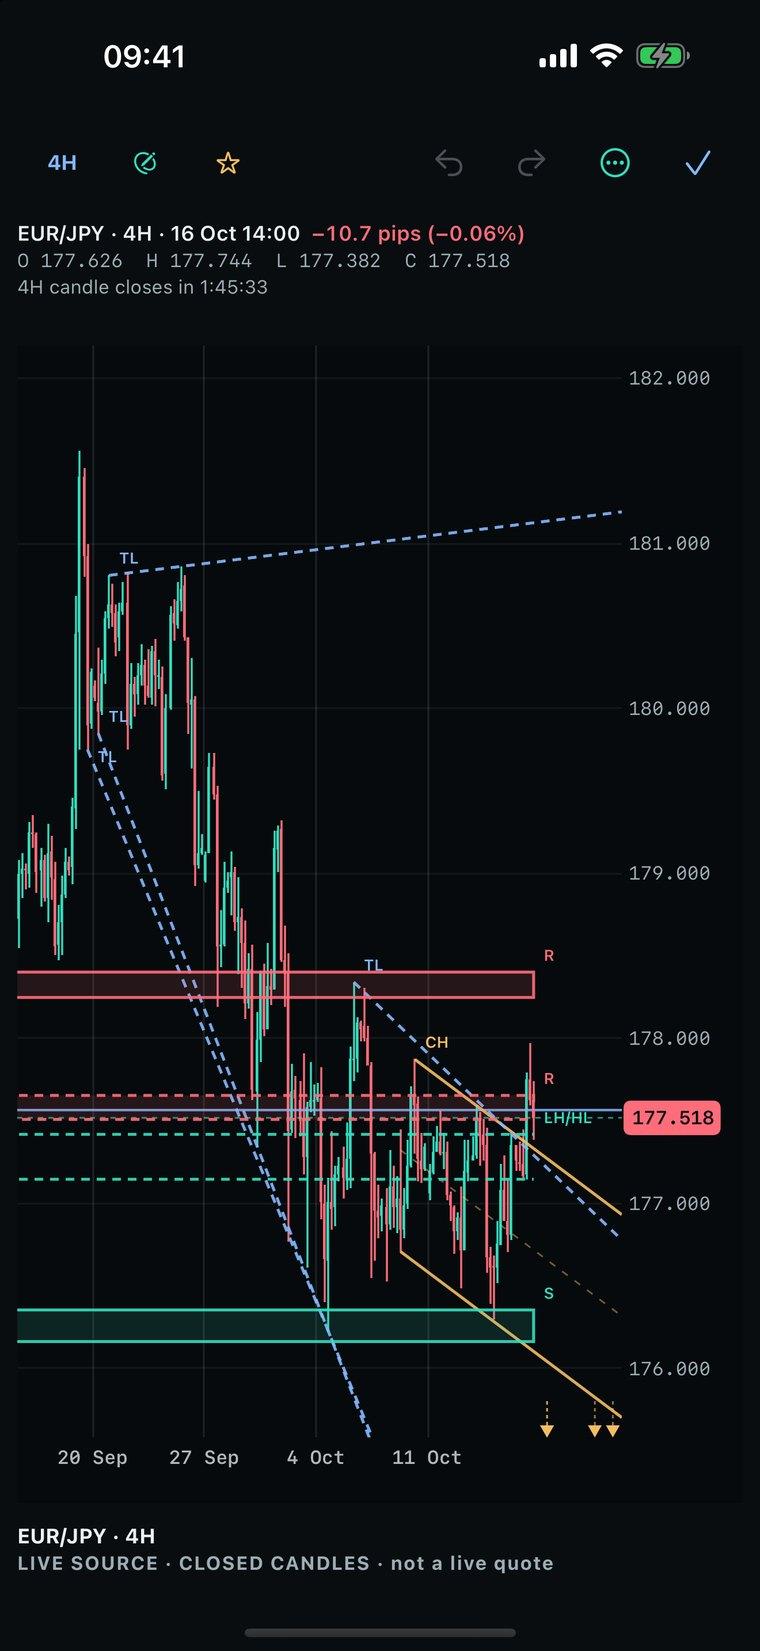
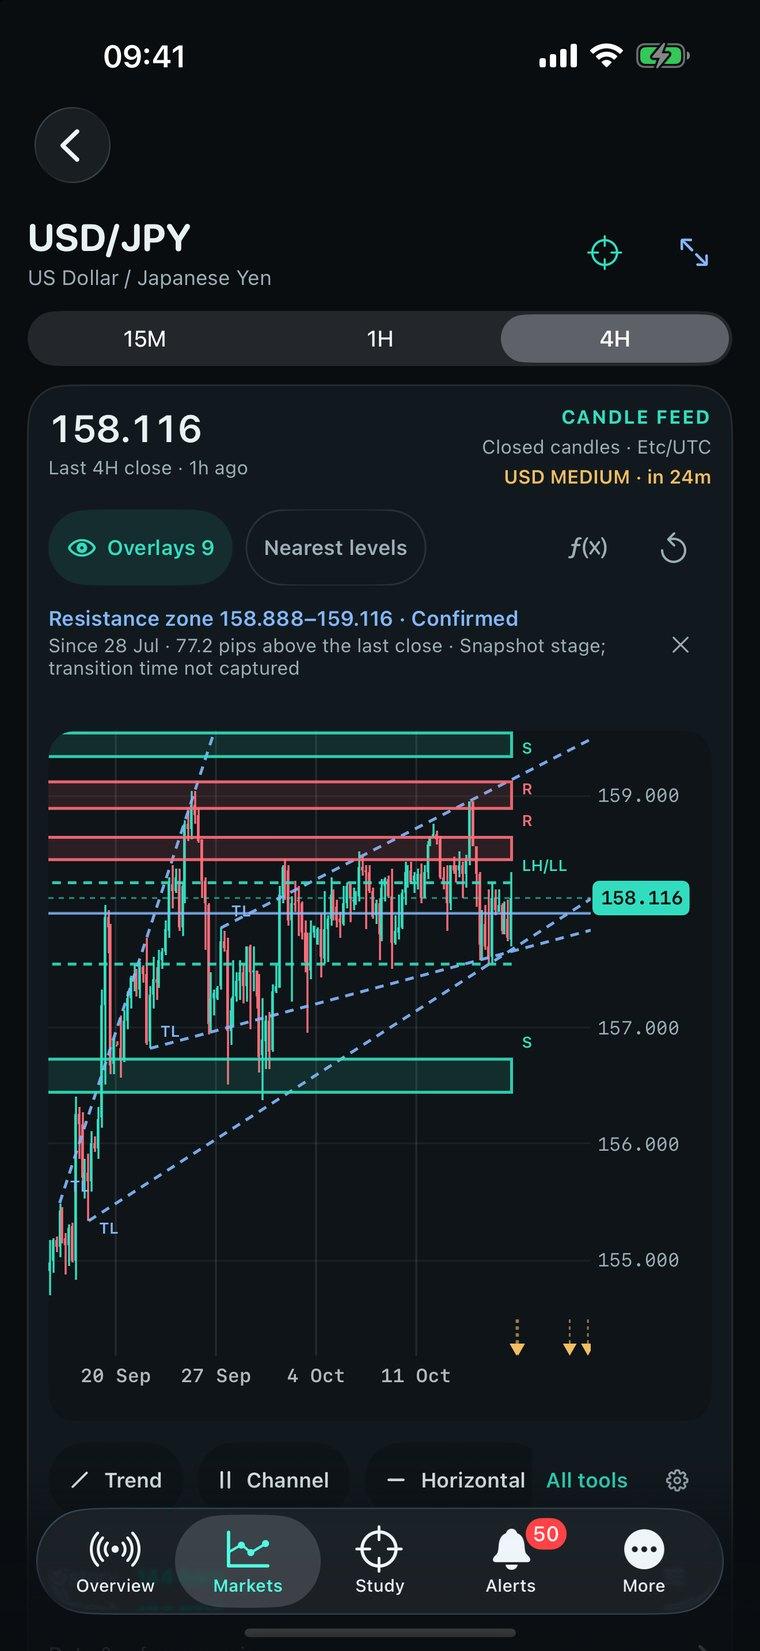
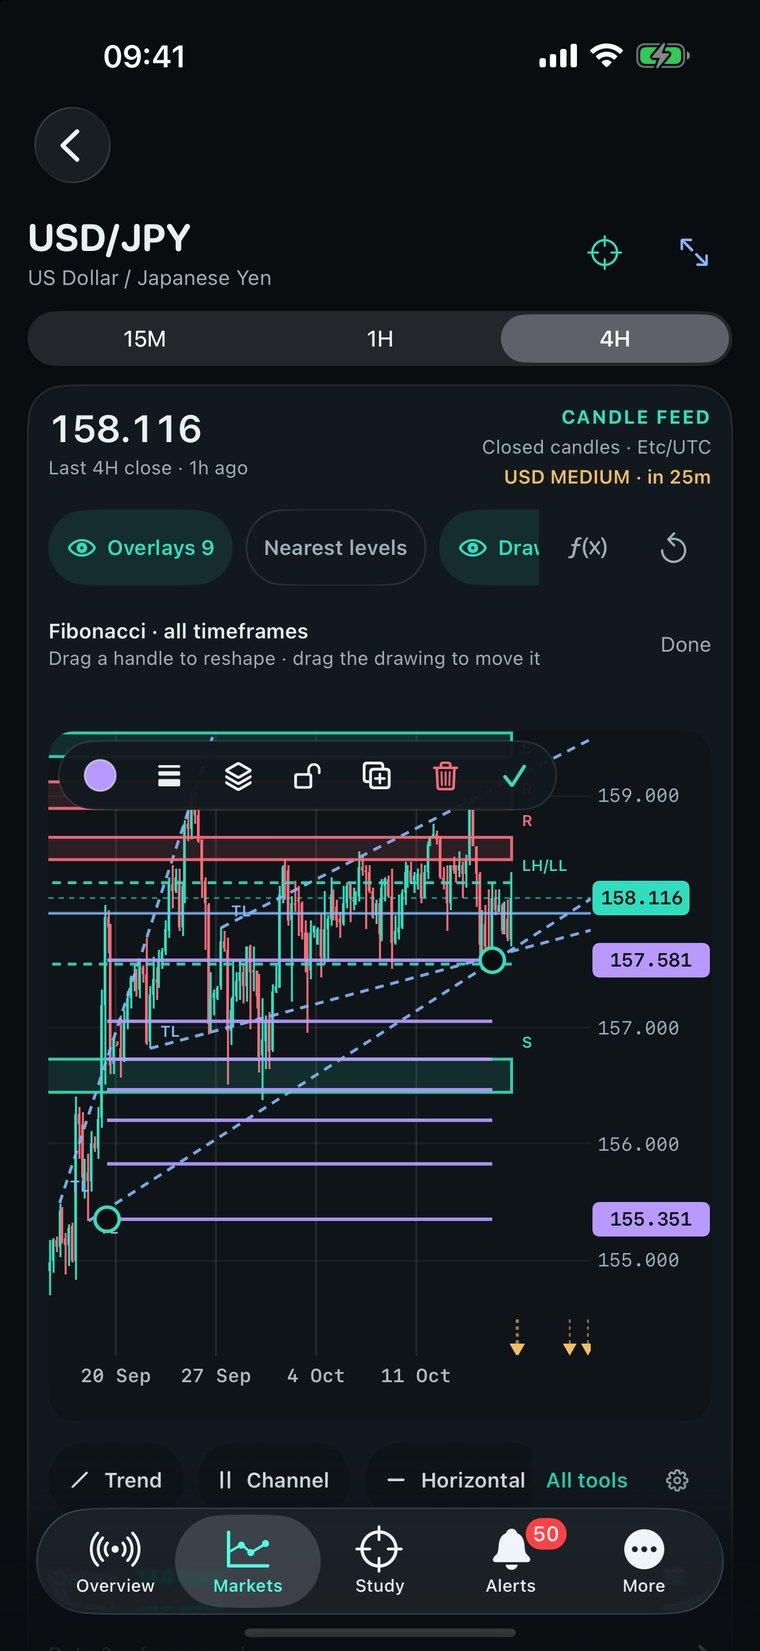
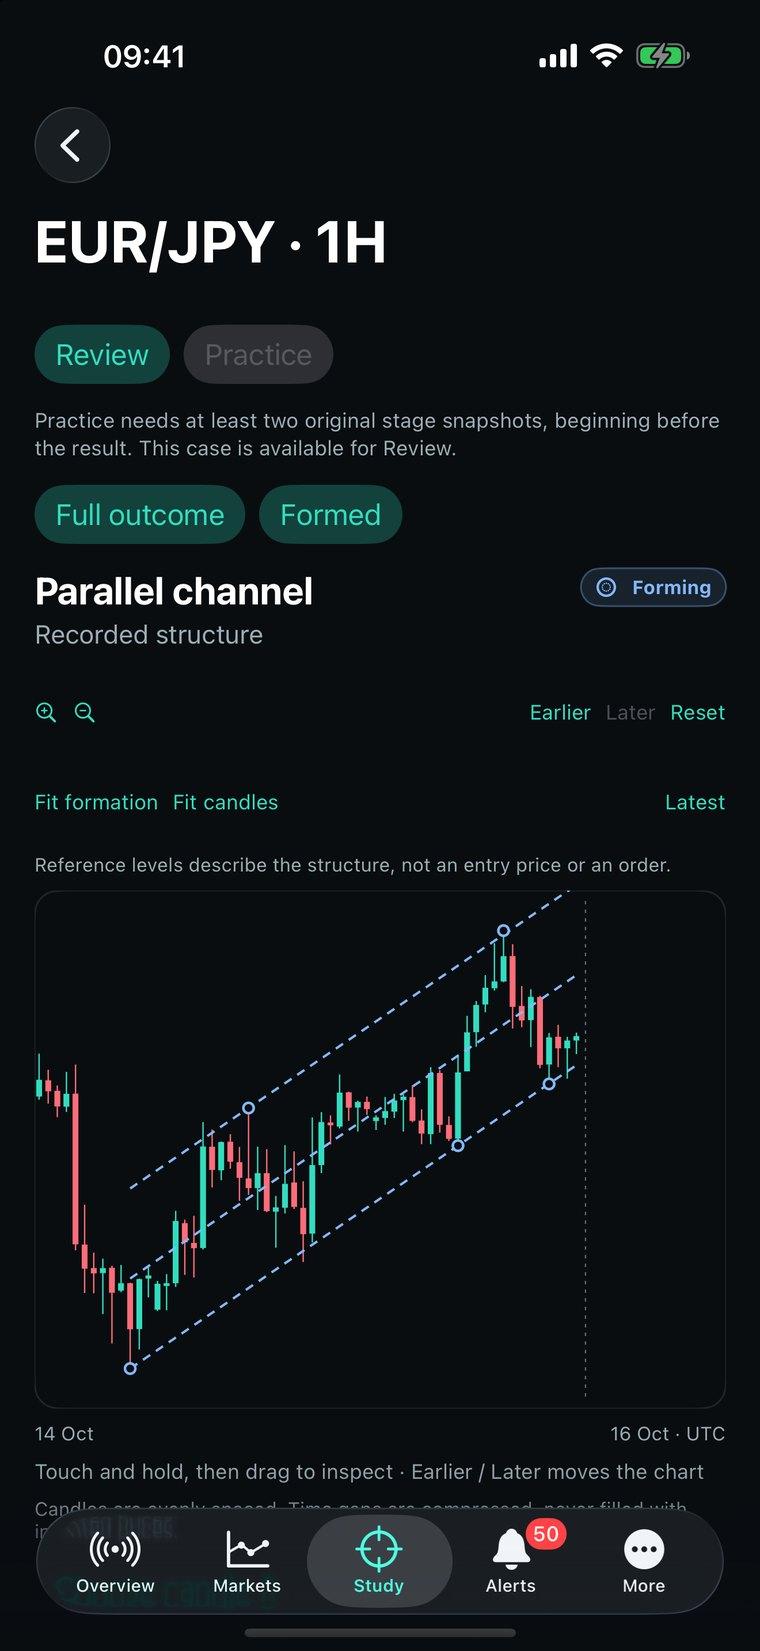
Three screens from the app itself, unedited. Detected patterns and levels on one side, your own drawings on the other, and an explanation behind every line.
Study
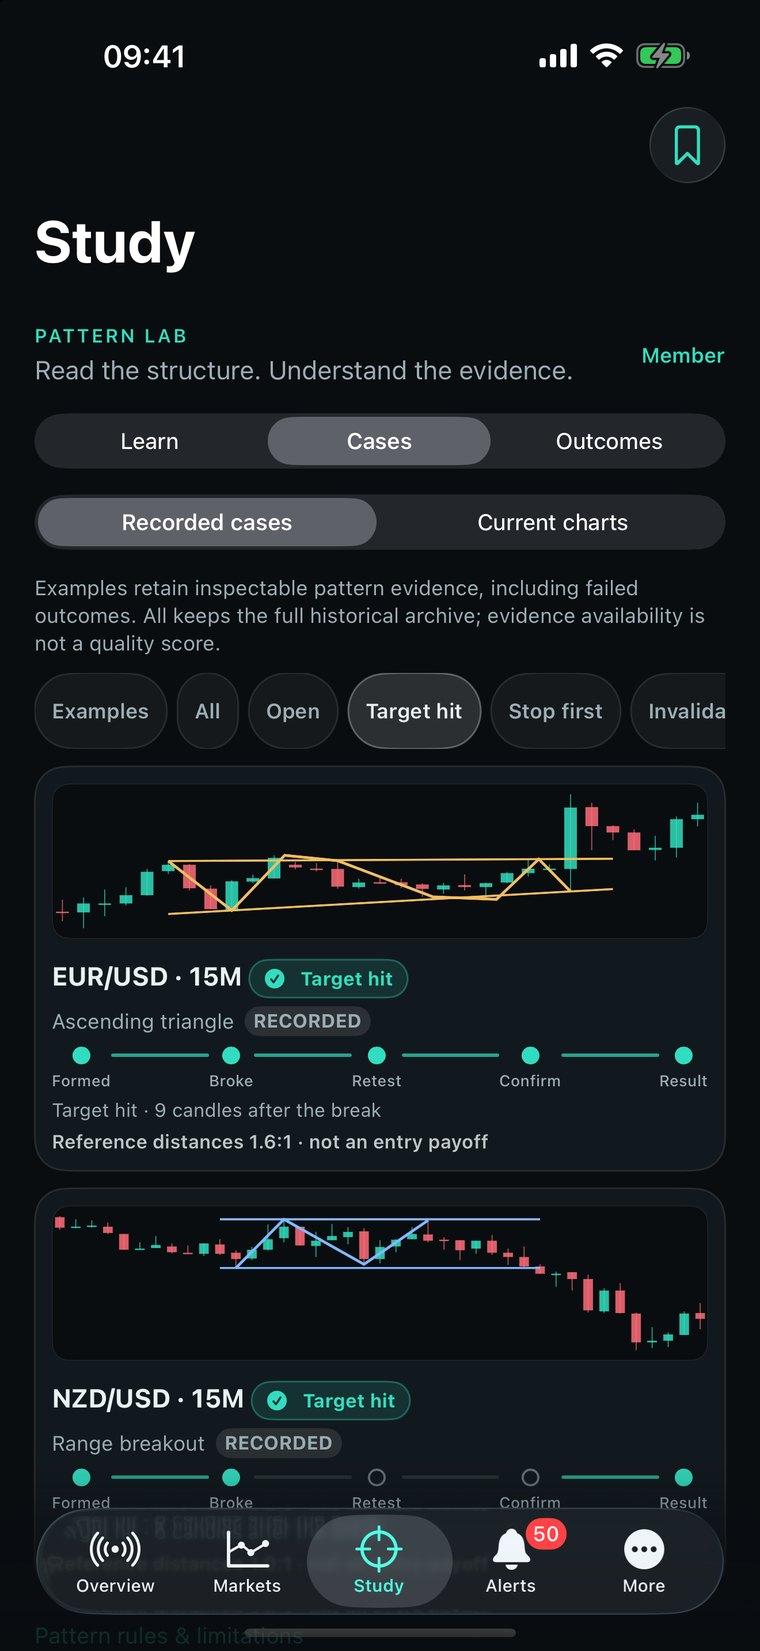
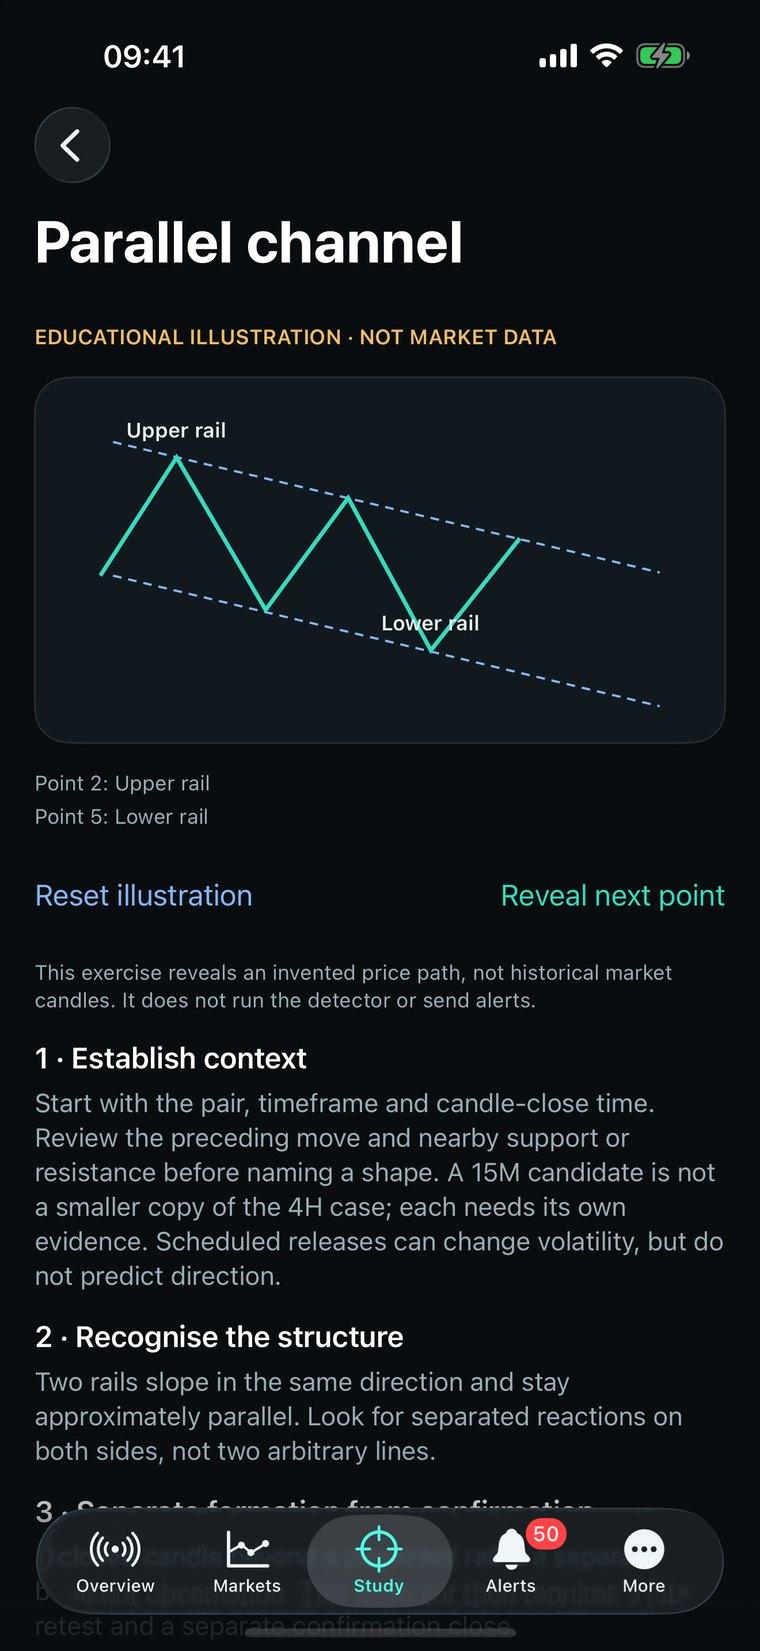
Patterns the detector records become cases you can study, from the swings that formed them to how they ended, including unsuccessful, invalidated and expired examples. Lessons teach each shape step by step.
Study the ascending-triangle guide for a recorded example, the app's labels and the limits of one case.
Use the pattern case review sheet to keep first-recorded time, stages and outcome limitations together.
Read a recorded case step by step, from its first-recorded stage to the limits of its outcome label.
Compare manual drawings with detected patterns and keep the origin of each chart annotation visible.
See all 16 patterns on one cheat sheet, then compare bull and bear flags with pennants, wedges and channels.
What it does
Channels, triangles, wedges, double tops and bottoms, harmonic ABCDs and more, detected on completed 15M, 1H and 4H candles. A pattern is never drawn from a candle that has not closed.
Support and resistance zones and trendlines are drawn automatically. Tap one to see when it formed, its current stage and how far price is from it.
Recorded patterns are tracked through formation, breakout, retest and result: target, stop or expiry. Unsuccessful, invalidated and expired cases can be studied alongside the rest.
Twenty-one pattern lessons with step-by-step illustrations and quick checks, linked to real recorded cases you can study.
Trend lines, channels, horizontal levels, rays, rectangles and Fibonacci, saved on your device, on any of the three timeframes.
Price alerts fire on the first candle that closes beyond your level, not on a wick, and Members can follow cases as they move between stages.
Built to be honest
Pattern apps are easy to make look good: draw on live candles, measure from the ideal price, and quietly drop the failures. FXPatternLab does none of that.
Detection, stages and alerts use completed candles. Nothing is drawn from a price that is still moving.
Recorded outcomes start at the close of the breakout candle and include a typical retail spread, not the ideal fill at the level.
Cases that stop out, dissolve or never break stay in the record. Nothing is removed to improve the picture.
The app reports what was recorded, failures included. It does not claim a win rate, and recorded outcomes do not establish accuracy or profitability.
Plans
The free level is not a trial: two pairs on 1H with the full detector, your own drawings and every lesson. Member adds all ten pairs, all three timeframes, recorded cases and background alerts. The store shows the price for your region before you subscribe.
See what each level includesQuestions
FXPatternLab is available now on Google Play for Android. The iOS version is coming soon to the App Store; to hear when it launches, email support and we will reply when it is available.
There is a free level with no purchase. Member is a subscription billed by Apple or Google; the store shows the price for your region before you confirm anything.
No. It has no broker connection, places no orders and holds no funds. It shows chart structure and recorded outcomes for study; every decision stays with you.
No. A pattern, level or alert is an educational observation, not a recommendation or forecast. Recorded outcomes describe what happened to past cases and do not establish accuracy or profitability.
Ten majors and crosses: EURUSD, GBPUSD, USDJPY, USDCHF, USDCAD, AUDUSD, NZDUSD, EURJPY, GBPJPY, EURGBP, on 15-minute, 1-hour and 4-hour candles. The free level includes EUR/USD and USD/JPY on 1H.
You choose a pair, timeframe and level. The alert fires on the first candle that closes beyond it; a wick through the level is ignored. Levels are checked on our server so the alert can arrive with the app closed, subject to your notification settings.
Use the FXPatternLab account deletion page on this site. Deleting an account does not cancel a store subscription; cancel that in the App Store or Google Play as well.
No. FXPatternLab is for educational purposes only. It is not financial, investment, tax or legal advice, and nothing in it is a personalised recommendation.
FXPatternLab · Android now, iOS soon