
Research guide · FXPatternLab
Manual chart drawings versus detected patterns
A drawing records a reader's interpretation of a chart. A detected pattern records the result of an algorithm under its rules. Keeping their origins visible makes it easier to compare ideas, review changes and understand which evidence supports a case.
Start with who created the annotation
If you choose the anchors of a trend line, channel or Fibonacci drawing, you are specifying a construction. Moving an anchor changes that construction. A tidy visual fit does not by itself establish that an automated detector identified the same shape at that time.
For a detected case, the useful questions are different: which pattern definition was evaluated, when was the case first recorded, and what stage did it have then? A manual line can help you study the chart, but its placement is not evidence of an earlier detection or notification.
Read the selected object in the supplied screen
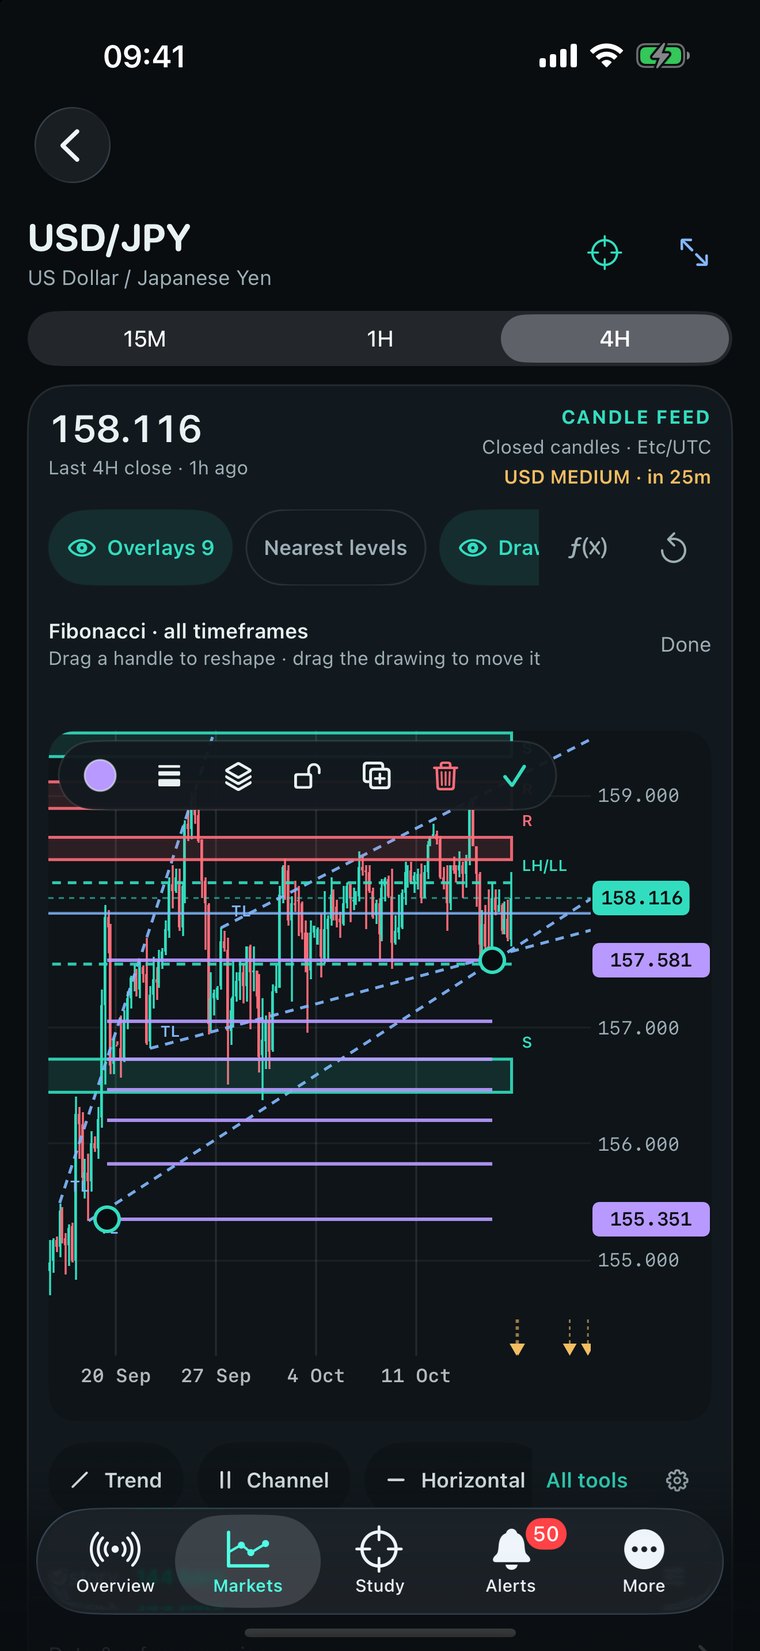
The FXPatternLab capture below shows USD/JPY with 4H selected and a candle-feed label saying Closed candles, Etc/UTC. The selected drawing is labelled Fibonacci, all timeframes. Handles and an editing toolbar appear on top of the chart.
The screen also contains other lines, zones and overlay labels. The selected Fibonacci object's origin should not be assigned to every visible annotation. Record which layer or object you are inspecting before describing what the entire chart means.
The image establishes what this historical iOS interface shows. It does not demonstrate a completed save, an alert delivery or the current controls in every platform version. Use a current build when documenting exact gestures or entitlement limits.
Separate chart changes from evidence changes
Moving a drawing changes your annotation. New candles change the observed chart. A detector changing a lifecycle label is a third event. Recording them separately prevents a later hand-adjusted line from being mistaken for the original detector boundary.
Keep a before image and an after image when testing an interpretation. Retain the timeframe, timezone and available candle range. If the later view includes new candles, say so; the two pictures no longer represent the same information set.
Do not infer an alert from a line
A line on a screen is not proof that a notification rule was saved or that a message reached a device. To review an alert, keep the configured condition, its evaluation time, the relevant observation and delivery evidence together.
A manual drawing condition and a detector case status can use different rules and timing. Establish which workflow is being discussed before diagnosing a missing notification. If a record contains only the screenshot, leave the alert's configuration and delivery status unknown.
Review the same chart without mixing origins
Illustrative review exercise. These are hypothetical records, not events or notifications generated by FXPatternLab.
| Record | Known information | Question to keep separate |
|---|---|---|
| Manual line | Reader places two anchors at 10:00 | Did the reader later move either anchor? |
| Detector case | Case first recorded at 10:15 | Which candles and rules were available then? |
| Notification | No delivery record supplied | Delivery remains unknown |
The line and case may describe a similar region of the chart, but their creation times and origins are distinct. The exercise cannot establish advance warning or predictive accuracy.
See the distinction in the app
A practical reading checklist
- Record the origin: your drawing, another overlay or a detected case.
- Keep object anchors, timeframe, timezone and observation time together.
- Retain the original view before changing a drawing or loading later candles.
- Verify alert configuration and delivery separately when those are part of the question.
Continue your research
Explore FXPatternLab and its current access options. The product page explains available features and plans; check your store for current platform availability and terms.
Educational content only. The app examples are supplied by Macro Research Technologies, the developer. Historical screens explain a display; illustrative examples explain a concept. Neither establishes future price direction or investment returns. Contact us with corrections.