
Screen walkthrough · FXPatternLab
How to read a recorded FXPatternLab case
A completed chart can make a pattern look obvious. The important research question is what was recorded, and when. Start with the case identity and first-recorded stage before interpreting an outcome label.
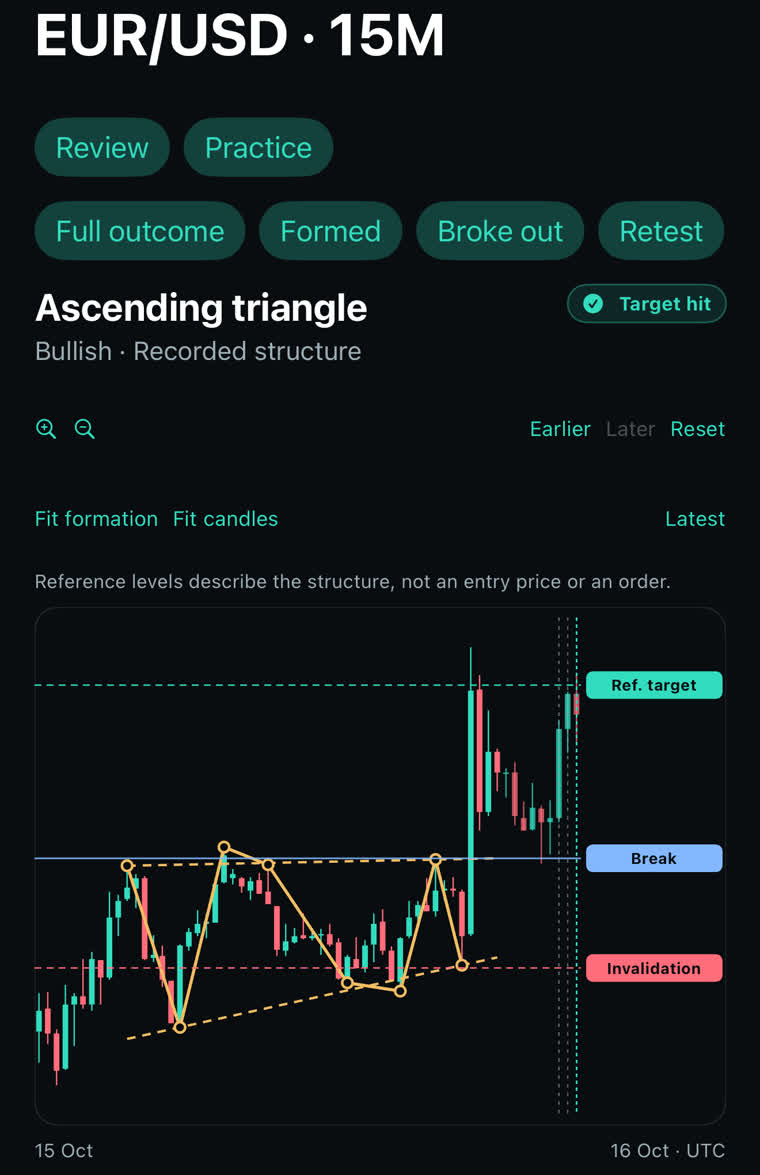
1. Establish the identity and clock
Read the instrument and timeframe first: this example is EUR/USD on 15-minute candles. Keep the chart timezone with the dates. A similar-looking shape on another timeframe is a different observation, not a confirmation of the same case.
For your own review, keep the case ID and version alongside the screenshot. A screenshot is useful for explaining the screen, but by itself is not a complete event log. The linked ascending-triangle guide contains the context for this specific historical example.
2. Ask when the case was first recorded
This case was first recorded at breakout. It must not be described as an advance alert identifying the shape before that breakout. The fact that earlier candles are visible on a chart does not establish that the detector or user had already recorded the case at that earlier time.
When comparing a live view with a later review, separate what was visible then from what appeared afterwards. Do not use later candles to justify a decision supposedly made earlier. If the first-recorded time is missing, keep that limitation in the review.
3. Interpret each reference label separately
Break identifies the displayed structural reference for breakout; Invalidation marks the displayed invalidation reference; Ref. target is the app's measured reference. These lines describe the recorded structure. They are not proof that an order could have been entered, filled or closed at those prices.
Whether a particular implementation evaluates a touch, a candle close, an elapsed time or another rule must be established from that case's applicable rules. Do not infer those exact rules from the line position alone. Invalidation and expiry also answer different questions: a structure can fail a rule or simply run out of its defined time window.
4. Keep outcome and performance separate
The app labels the example Target hit. That is a case status, not a realised return. It does not account for a user's timing, spread, slippage, costs or execution, and it does not show how often other cases fail, expire or are invalidated.
This walkthrough reuses one example to explain how to read a record. It is not a new outcome study. A meaningful collection would need distinct cases, explicit selection rules, consistent definitions and unsuccessful examples, with enough history to establish what was known at each stage.
Your review checklist
- Record the case ID, pair, timeframe and timezone.
- Separate first-recorded time from earlier candles visible in hindsight.
- Write down the applicable rules rather than guessing them from the lines.
- Record the status without translating it into a return or a success-rate claim.
Use the free companion worksheet to keep observations and unknowns together.
Explore the app
Explore FXPatternLab, its features and current access options. Check the store for platform availability, eligibility and renewal terms before subscribing. This guide requires no subscription.
Related reading: Manual chart drawings versus detected patterns.
Evidence and corrections
This is a first-party explanation by the app developer, based on the screenshot displayed above. It is not an independent review or a test of predictive accuracy. Missing dates, model rules or outcomes are not inferred from the image. Send a correction if your version differs.