
Guide · Chart structure
Ascending triangle pattern: identification, invalidation and limitations
An ascending triangle is one of the most commonly taught chart patterns: a flat ceiling with a rising floor beneath it. It's easy to see in hindsight and much harder to judge while it's forming. This guide covers how the structure is defined, what "confirmation" and "invalidation" mean, how breakouts fail, and why no pattern deserves blind trust.
What it looks like
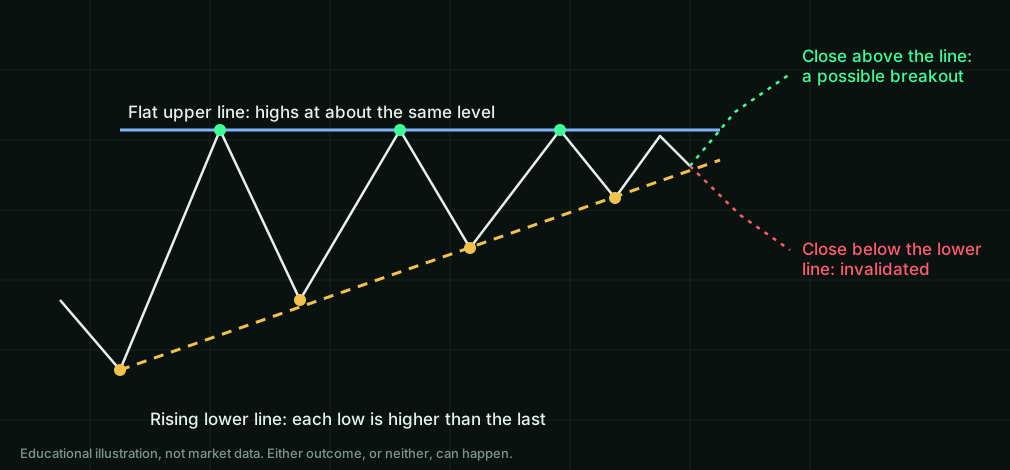
An ascending triangle has two boundaries:
- A horizontal upper line (resistance): price reaches roughly the same high at least twice and turns lower each time.
- A rising lower line: each pullback stops at a higher low than the one before. At least two higher lows are needed to draw the line.
Because the highs are flat and the lows rise, the range narrows as the lines converge. It's a compression: the swings get smaller until price either leaves the structure or the structure stops making sense.
Identification checklist
- Touches: at least two highs near the same level and at least two higher lows. More clean touches make the lines more defensible. They don't make the outcome more certain.
- Flat really means flat: the highs should sit in a tight band. If the "flat" line tilts noticeably, you may be looking at a wedge or a channel instead.
- Proportion: the structure should be clearly visible on the timeframe you're studying. A triangle spanning three candles is noise.
- Context: note where the structure sits: after a rise, inside a range, near a major level. Textbooks often describe the ascending triangle as a continuation pattern after a rise, but in practice it appears in many contexts.
- Timeframe: the same price action can form a triangle on 15-minute candles and nothing at all on 4-hour candles. State the timeframe whenever you describe a pattern.
A note on volume: classic chart-pattern texts discuss falling volume during the formation. Spot FX trades across many venues and has no single central volume figure, so that cue isn't reliably available for currency pairs.
Is an ascending triangle bullish or bearish?
By convention, it's described as bullish. The rising lows are usually read as buyers stepping in at higher prices beneath a level where sellers keep appearing. That is a description of the shape, not a prediction.
- A close above the flat line meets a breakout rule. It doesn't establish that the pattern is reliable, and many breakouts fail (see how breakouts fail).
- The structure can resolve downwards. A close below the rising lower line invalidates the bullish reading altogether.
- Context changes the reading. The same shape inside a range, or just before a scheduled data release, carries different risks. See how to read an economic calendar.
Breakout, confirmation and invalidation
These three words carry most of the meaning, so define them precisely:
- Breakout: price moves beyond the flat upper line.
- Confirmation: a rule for deciding the breakout counts. A common one is a candle closing beyond the line, rather than merely poking above it intra-candle. Waiting for the close removes many short-lived spikes. It doesn't remove failure.
- Invalidation: the point at which the structure no longer describes price, typically a close below the rising lower line. After that, the triangle is simply a set of lines on a chart.
Some texts also describe a measured reference. A measured reference projects the pattern's height from its breakout boundary. It is a geometric reference, not a forecast, trading instruction or guaranteed destination.
How breakouts fail
Failure isn't the exception you can skip; it's part of the pattern's normal behaviour:
- False breakout: price closes above the line, then falls back inside and continues lower.
- Breakdown instead: price exits through the rising lower line rather than the top.
- Dissolving structure: price drifts sideways past the point where the lines meet, and the triangle stops being meaningful.
- News shocks: scheduled releases (see our guide to reading an economic calendar) can move price straight through any line in either direction.
Studying failures is as useful as studying successes, and most pattern illustrations only show successes.
Limitations, honestly
- Subjectivity: two careful people can draw different lines on the same chart.
- Hindsight bias: completed patterns look obvious afterwards; forming ones don't.
- Selection bias: textbook examples are chosen because they worked.
- No guaranteed odds: we deliberately give no success rate here. Published pattern statistics vary widely with the market, timeframe, definitions and period studied, and they don't transfer automatically to currency pairs or to the future.
How FXPatternLab helps you study it
FXPatternLab is an educational chart-study app for 10 major FX pairs. It doesn't place trades and gives no instructions to trade.
- Detection on closed candles: triangles, wedges, channels, levels and trendlines are drawn on closed 15M, 1H and 4H candles.
- Labelled levels: recorded structures show their invalidation level, break level and a reference level measured from the pattern's own size, described as reference points, not entries or targets to trade.
- Recorded cases, including failures: recorded cases are followed through their lifecycle, from formation through break to result. The archive includes cases that went the wrong way, were invalidated or timed out, so you can study failures as well as successes. It is a study archive; it doesn't measure detector accuracy.
- Lessons: short illustrated lessons for each pattern family, with quick checks.
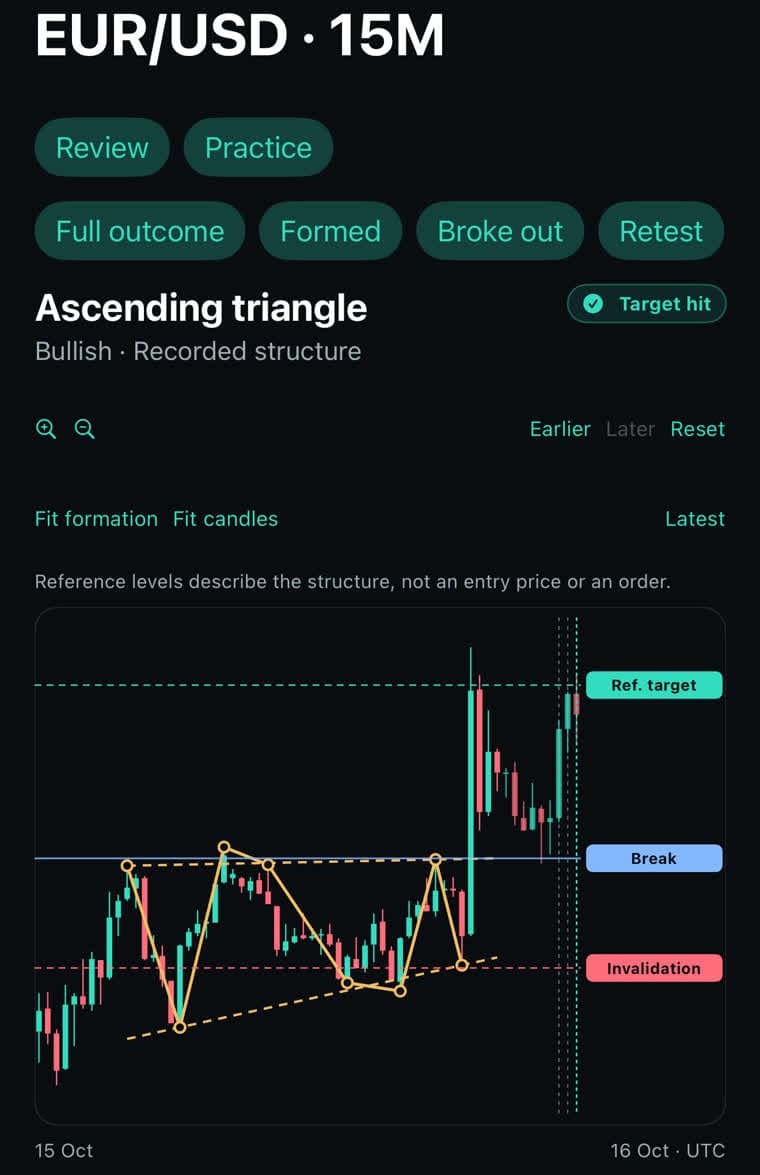
What to notice in this example:
- The flat upper line (labelled Break) is touched several times. One high pokes slightly above it before price falls back, which shows why "flat" means "within a tight band", not "to the pip".
- The rising lower line connects higher lows. The Invalidation level sits near the most recent low.
- The Ref. target line is the structure's measured reference. The app itself notes that "reference levels describe the structure, not an entry price or an order."
FXPatternLab is free to start, with two pairs on 1H, and Member subscriptions unlock all pairs and timeframes. There's no free trial. Available on Google Play; iOS coming soon. About FXPatternLab
Key takeaways
- An ascending triangle is a flat top with rising lows: a narrowing range.
- Define breakout, confirmation and invalidation before you look for the pattern, not after.
- Breakouts fail often enough that failure deserves as much study as success.
- No pattern carries a guaranteed probability; be sceptical of anyone who quotes one without its data, period and definitions.
Further reading
Use the free pattern case review sheet to keep detection timing, recorded stages and limitations together.
See every other common pattern in the chart patterns cheat sheet, including bull and bear flags.
- Lo, A. W., Mamaysky, H. and Wang, J. (2000). Foundations of Technical Analysis: Computational Algorithms, Statistical Inference, and Empirical Implementation. NBER working paper; published in The Journal of Finance. An academic attempt to define chart patterns precisely enough for an algorithm to detect them, and useful background on why precise definitions matter. Note its scope: it studies daily data on US stocks, and its triangle definitions differ from the flat-top ascending triangle described here. It doesn't evaluate FX, 15-minute charts or FXPatternLab.
Sources are cited so you can verify them. They are independent of Macro Research Technologies and have not reviewed or approved this content. Educational content only, not financial advice.