
Research guide · MacroMatrixFX
Fundamental currency strength versus price strength
Before using a currency-strength ranking, identify what it measures. A price measure describes relative movements over a chosen window. A fundamental model interprets selected economic evidence. A currency can rank differently on the two without either display being calculated incorrectly.
What does a price-based strength measure answer?
Start with the comparison basket and time window. A currency can rise against one counterpart and fall against another. It can also gain over one session while remaining lower over a month. A ranking without these definitions is hard to interpret or reproduce.
An effective exchange-rate index is one particular basket-based measure. The BIS calculates its nominal indices from trade-weighted bilateral rates and adjusts them for relative consumer prices to obtain real indices. That is a defined statistical measure, distinct from an app's economic score or a simple average of daily pair changes.
What does a fundamental reading answer?
A fundamental assessment organises inputs such as monetary policy, inflation, growth and positioning into a model interpretation. The selection, transformations and weights matter. A headline score cannot tell you whether the inputs are current, conflicting or incomplete; those details belong beside it.
Keep observed quantities and model quantities separate in your notes. A policy rate is an observed rate on a specified date. A model contribution is an interpretation of an input under particular rules. A spot return is a price change over an interval. They should not be compared as though they shared units.
How to read the MacroMatrixFX currency view
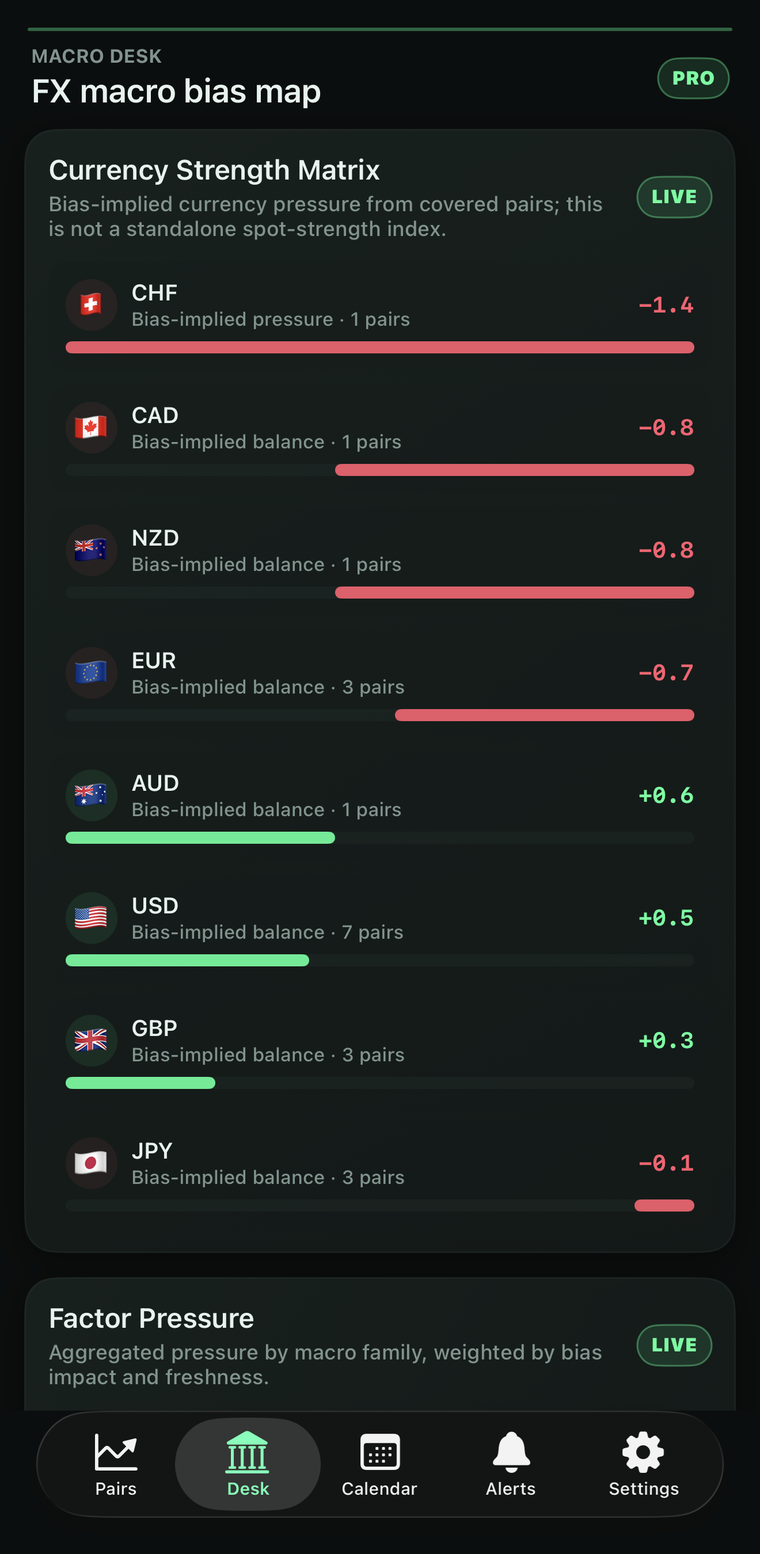
The supplied Currency Strength Matrix explicitly describes bias-implied currency pressure from covered pairs. It also states that it is not a standalone spot-strength index. Read that definition before interpreting the bars as recent exchange-rate performance.
Coverage is visibly uneven: in this capture USD has seven contributing pairs, EUR has three and CHF has one. Those counts help explain how much of the covered pair set sits behind each row. Seven observations sharing one currency are not seven independent economic confirmations.
The historical screen shows CHF at -1.4 and USD at +0.5. These are displayed model values, not percentage returns. The LIVE badge belongs to the original interface; the image below is a static historical capture, and neither its capture date nor platform was recorded with the file.
What to do when price and fundamentals disagree
Write down both definitions and their dates. Check whether the price window begins before or after a relevant release, whether the fundamental input has updated, and whether different currency coverage explains the comparison. Leave the cause unresolved when the evidence does not establish it.
Disagreement can be worth studying without predicting that one measure must catch up with the other. Preserve the observation first. Looking at later prices before recording your interpretation can turn an uncertain contemporaneous view into an apparently obvious explanation in hindsight.
A two-measure research note
Illustrative example only. These values are invented to demonstrate different units; they are not app output or a historical event.
| Observation | Recorded value | What it establishes |
|---|---|---|
| Price over a defined session | +0.8% against a named basket | Appreciation over that basket and interval |
| Fundamental assessment | Neutral, with one stale input | The model's qualified interpretation at its observation time |
| Research conclusion | The measures disagree | A question to investigate; no required reversal follows |
The useful output is a dated comparison, including the basket, interval, model definition and missing evidence. Do not subtract the score from the return or turn their difference into a probability.
See the distinction in the app
A practical reading checklist
- Name the measure: observed price performance or model interpretation.
- Record the basket or pair coverage, window, units and observation time.
- Inspect factor freshness and conflicts before interpreting a model score.
- Keep disagreements visible without assuming a future convergence.
Continue your research
- What is a fundamental bias in forex and gold?
- Read a pair-analysis screen step by step
- Free market evidence checklist
Explore MacroMatrixFX and its current access options. The product page explains available features and plans; check your store for current platform availability and terms.
Educational content only. The app examples are supplied by Macro Research Technologies, the developer. Historical screens explain a display; illustrative examples explain a concept. Neither establishes future price direction or investment returns. Contact us with corrections.