
Screen walkthrough · MacroVolt
How to read MacroVolt's gold factor breakdown
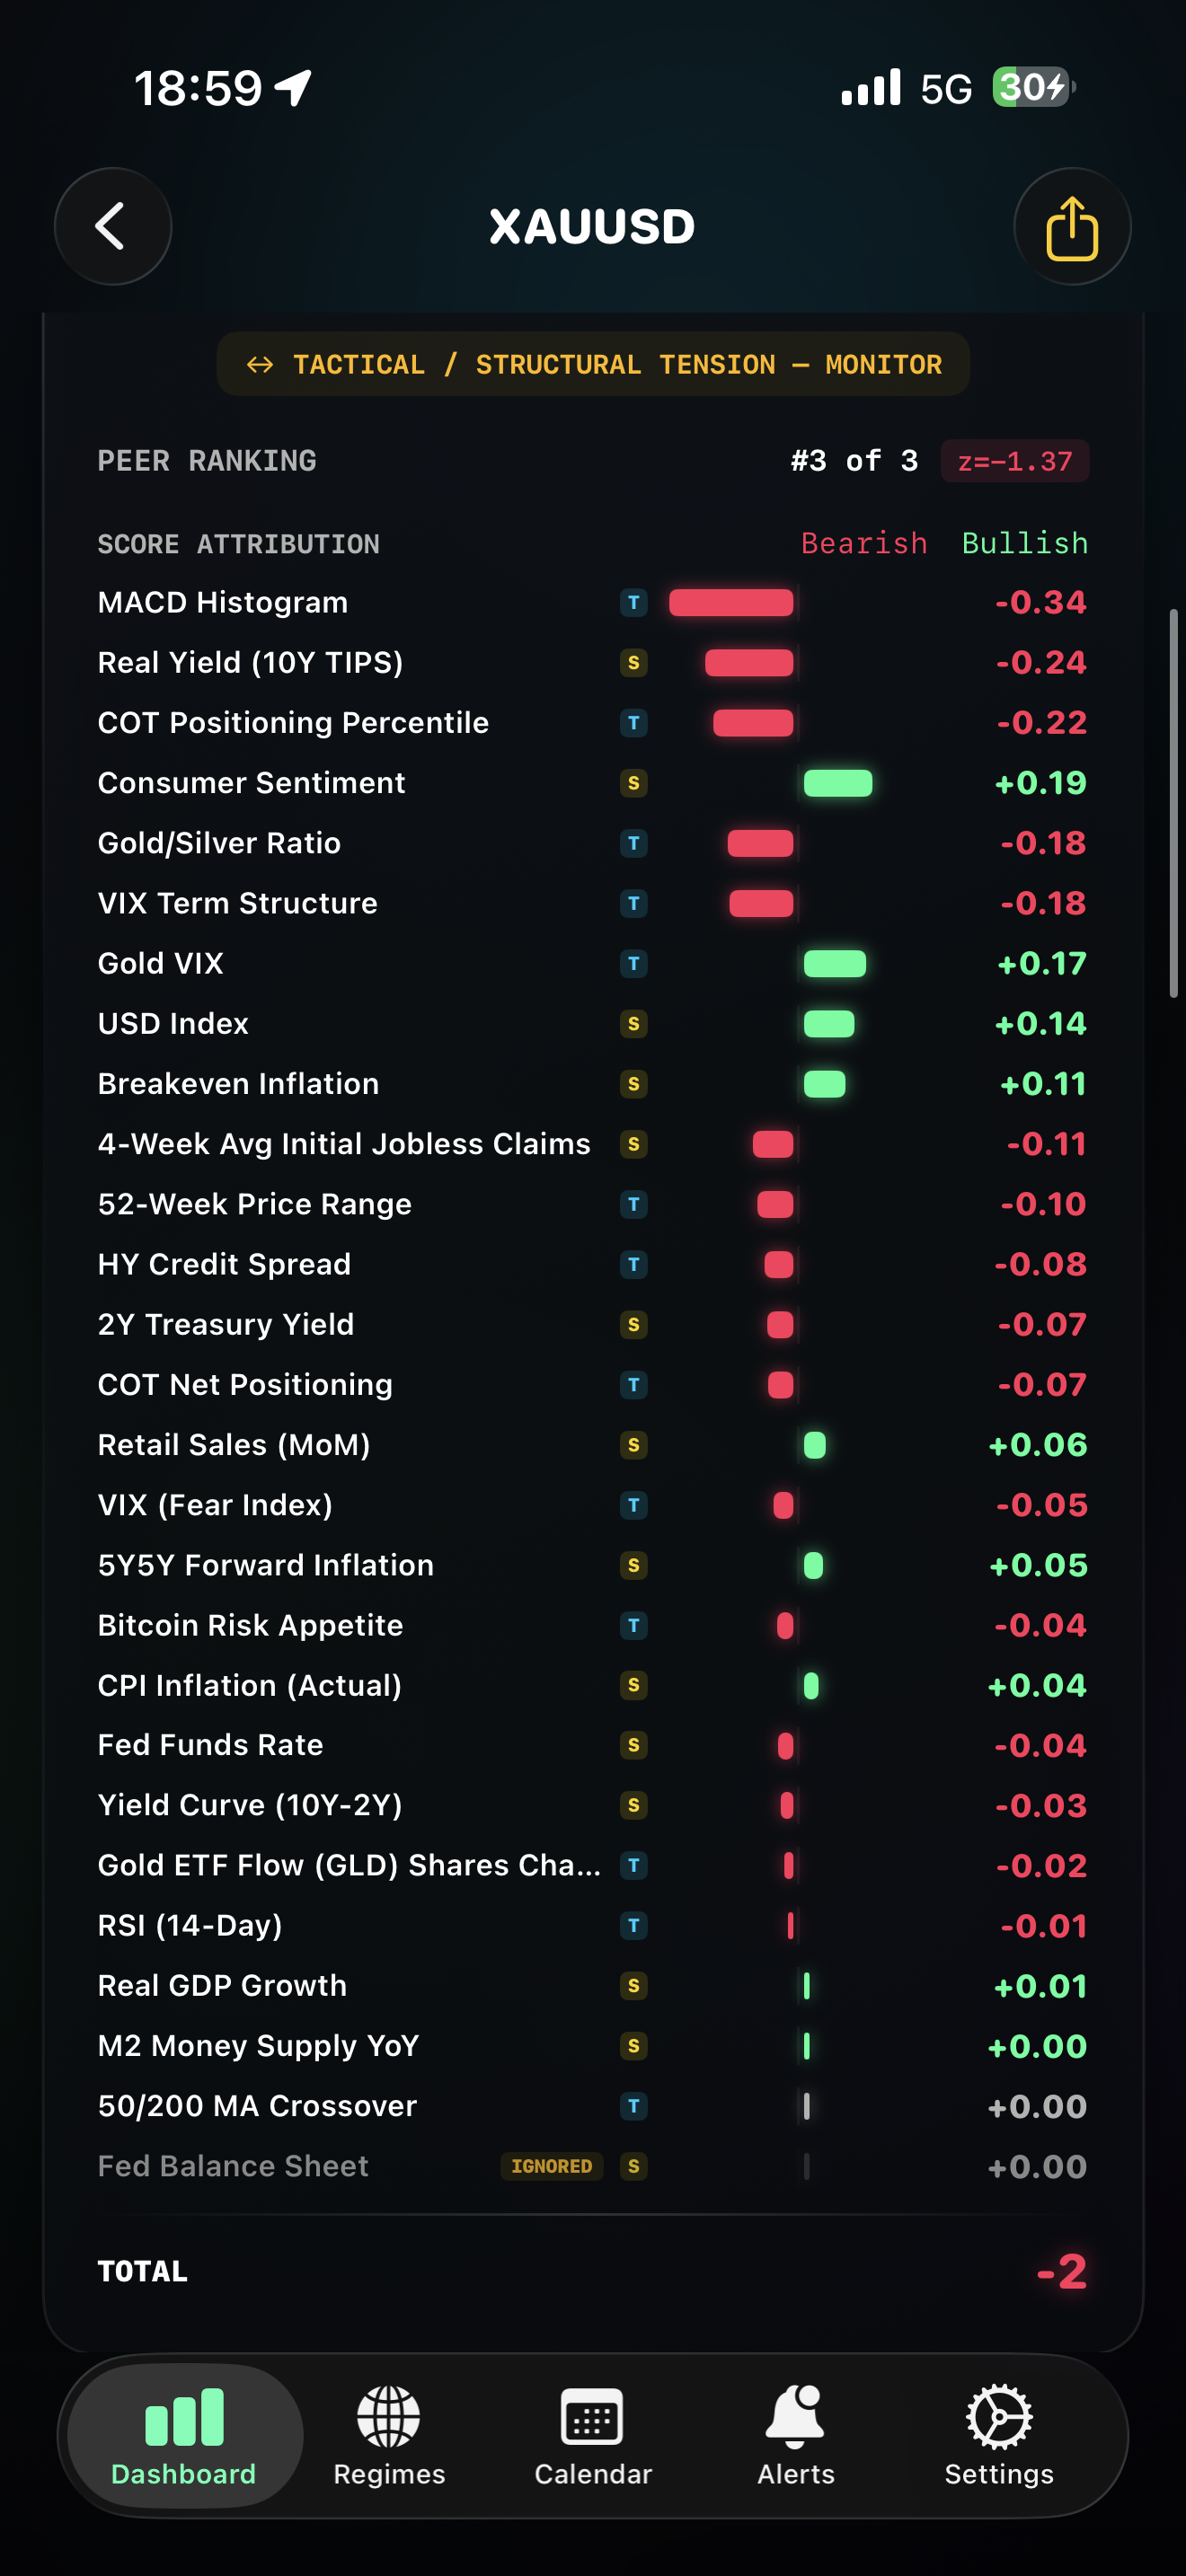
A factor breakdown helps you see disagreement that a total score can hide. This gold example shows economic, positioning and technical inputs together, with contributions on both sides. It explains the model display, not what gold will do next.
1. Identify what the numbers measure
The instrument is XAUUSD. Under Score Attribution, MACD Histogram is shown at -0.34 and Real Yield (10Y TIPS) at -0.24, while Consumer Sentiment is +0.19 and USD Index is +0.14. These are displayed score contributions. They are not raw interest rates, percentage returns or the size of a price move caused by each factor.
In particular, a positive USD Index contribution does not tell you that the underlying dollar index rose. A transformed model contribution and its source observation are different quantities. To explain the transformation precisely, you need the model definition and input values for that version.
2. Preserve the disagreement
The banner reads Tactical / Structural Tension - Monitor. Individual rows carry T or S badges and point in different directions. Reporting only the total -2 would discard that visible disagreement. The better note includes the tension banner and both supportive and opposing rows.
This is a mixed-factor display, not a pure fundamentals-only list: it includes price-derived technical measures as well as macroeconomic and positioning measures. Several inputs can describe overlapping conditions. Counting the coloured bars is not a count of independent confirmations.
3. Distinguish ignored, zero and unknown
The balance-sheet row is explicitly marked Ignored with +0.00. Other rows show +0.00 without that same marker. Those displays should not silently be treated as the same state. A rounded zero alone cannot tell you whether an underlying value was exactly zero, small, unavailable or handled by another rule.
The screenshot does not disclose all input dates, the full calculation or the reason for the ignored row. Do not reconstruct the model from rounded visible contributions or assume that every input was fresh because the app screen was open.
4. Write a factor note, not a forecast
For this example, a defensible note says: gold factor display; historical iOS capture of unknown date; total -2; tactical/structural tension; both positive and negative contributions; one row explicitly ignored; input freshness and subsequent price outcome unverified.
For a new observation, record its actual time and retain the factors before looking at later prices. If you compare two observations, keep model version and input definitions consistent. A changed score does not prove which event caused a market move.
Your review checklist
- Name the instrument and observation time.
- Distinguish score contributions from raw input values and returns.
- Retain opposing factors, horizon tension and ignored-input labels.
- Check timestamps and definitions before comparing readings or interpreting a zero.
Use the free companion worksheet to keep observations and unknowns together.
Explore the app
Explore MacroVolt, its features and current access options. Check the store for platform availability, eligibility and renewal terms before subscribing. This guide requires no subscription.
Related reading: Gold and real yields.
Evidence and corrections
This is a first-party explanation by the app developer, based on the screenshot displayed above. It is not an independent review or a test of predictive accuracy. Missing dates, model rules or outcomes are not inferred from the image. Send a correction if your version differs.